Executions
Overview
Executions are the running instances of operations. They are single runs of a targeted operation. Once an operation is scheduled to execute on a given DPhi system (Clustergate-2 Engineering Model or Flight Model, for example), the worker decodes the operation's YAML file and executes it task by task. This creates a task run for each task in the operation's task list.
When an operation is requested, it spawns an execution instance. You can inspect its details as shown below:
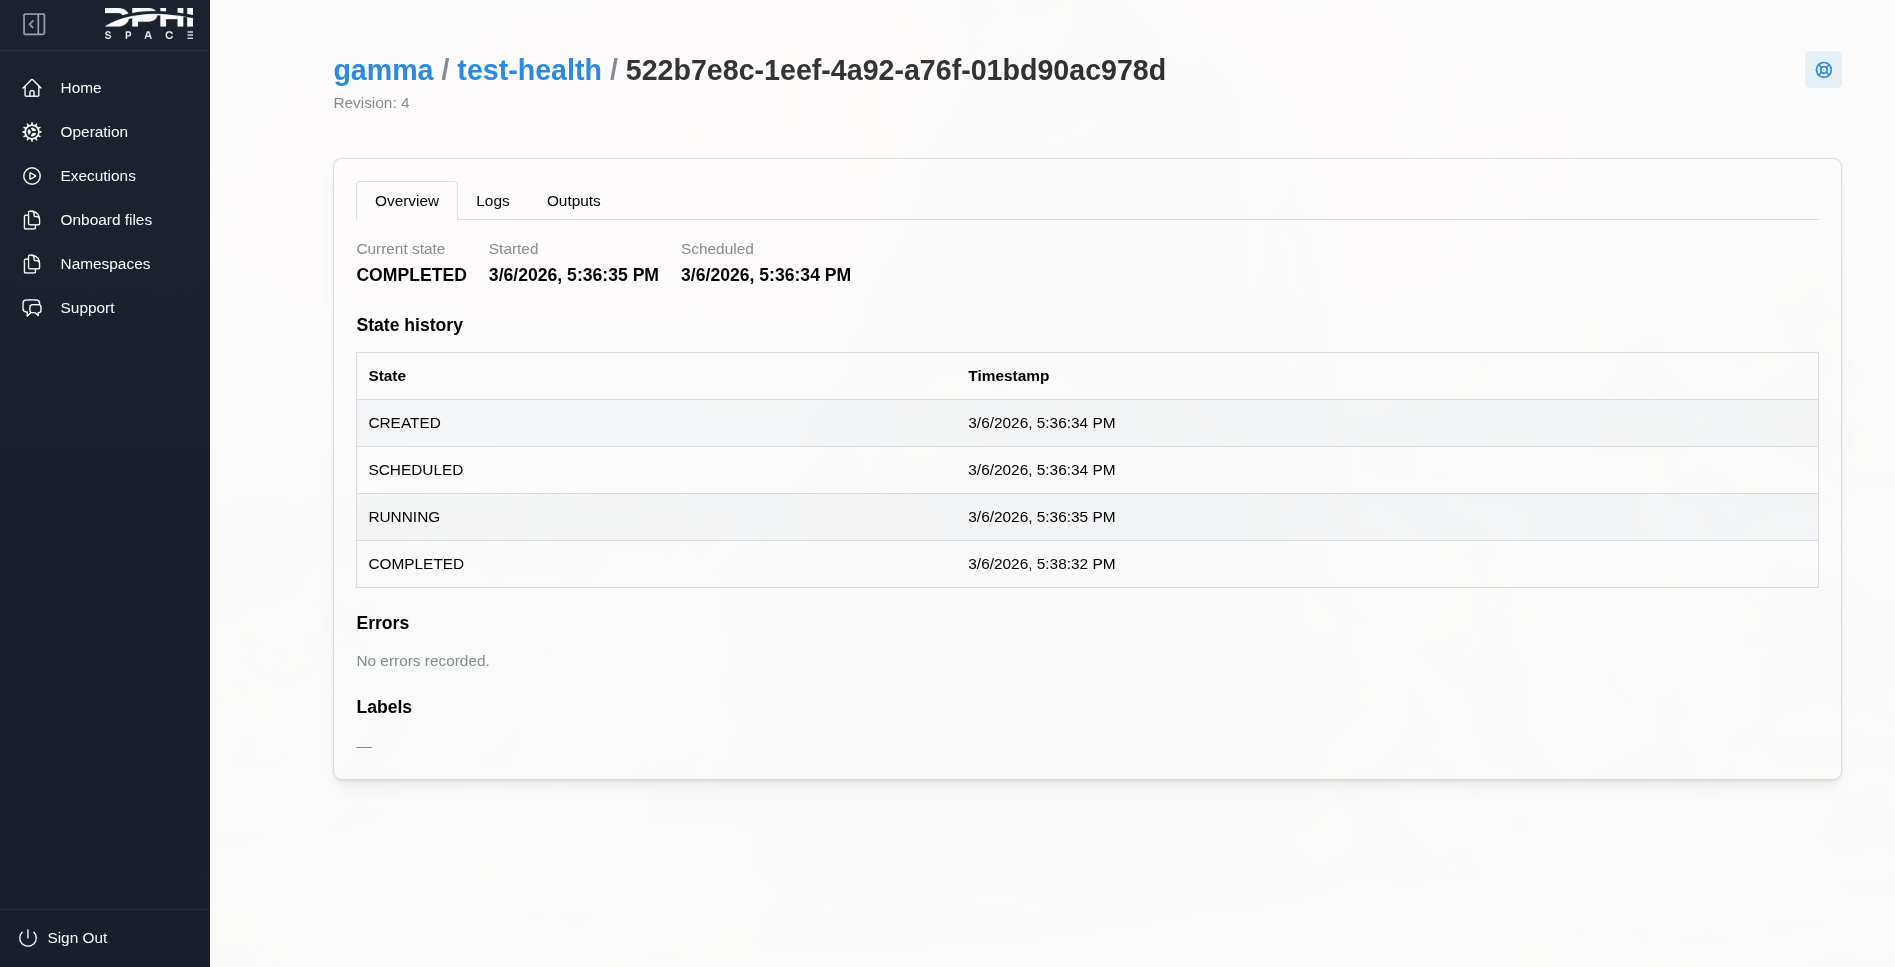
Here you can see the execution state history as well as its associated logs and outputs.
Typical flow
- Select the targeted system on which the operation will be executed, for example
cg2.emorcg2.fm. - Create or update an operation definition.
- Execute the operation and monitor task states.
- Review logs and download outputs as needed.
Tasks
Logs tab
The task history can be inspected under the logs and outputs tabs. It displays task metadata and state history, as well as any logs associated with a task.
Each task run has associated metadata, such as:
- Execution ID
- Task ID
- State
- Start and End Dates
Task states
Task states represent where a task is in its lifecycle. The exact sequence can vary by task, but you will commonly see:
- CREATED: The task run has been created and is waiting to be scheduled.
- SCHEDULED: The task is queued and ready to run. At this stage, it cannot be deleted anymore.
- RUNNING: The task is actively executing.
- SUCCESS: The task finished successfully.
- FAILED: The task finished with an error. Check logs and error details.
Some tasks may also report additional transitions (for example, retries). Use the task history timestamps to understand where time was spent.
This can provide insight into why execution failures might occur, such as in the following example:
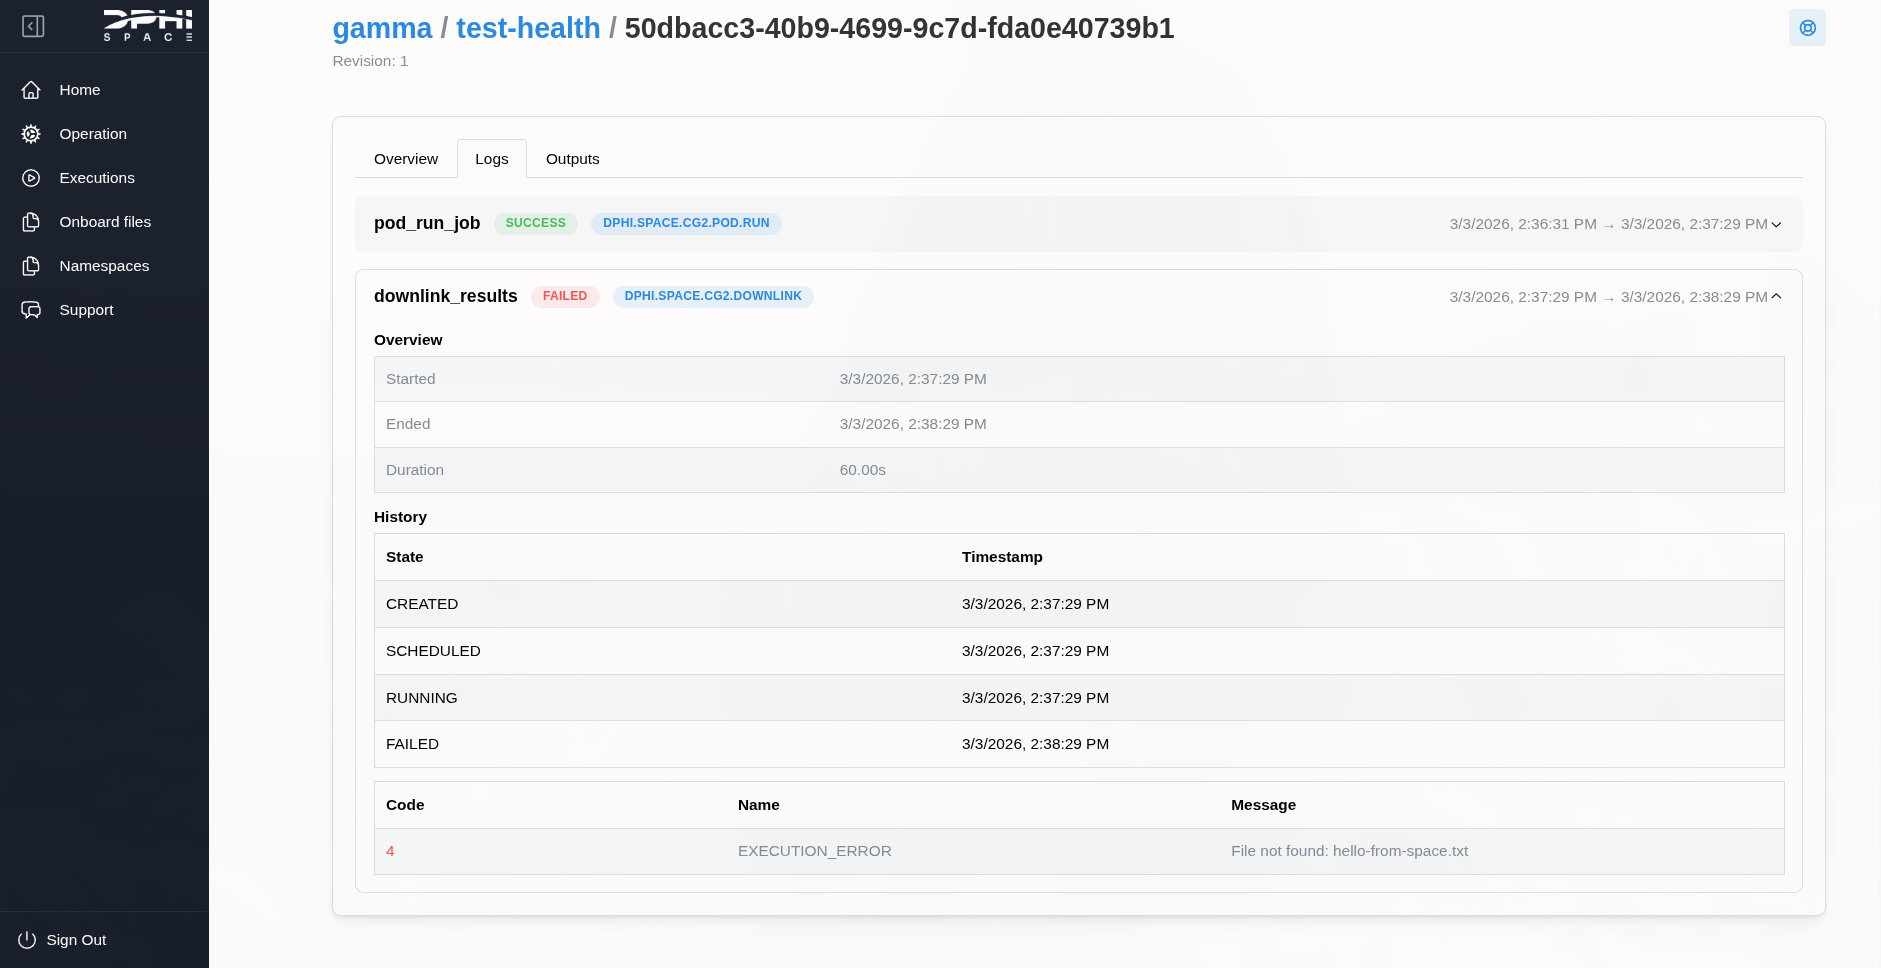
Here we see that the task failed to downlink the file (hello-from-space.txt) from the user's volume onboard Clustergate-2 because the file did not exist.
Outputs tab
On the run below, the downlink task on Clustergate-2 (dphi.space.cg2.downlink) was successful and generated the following output:
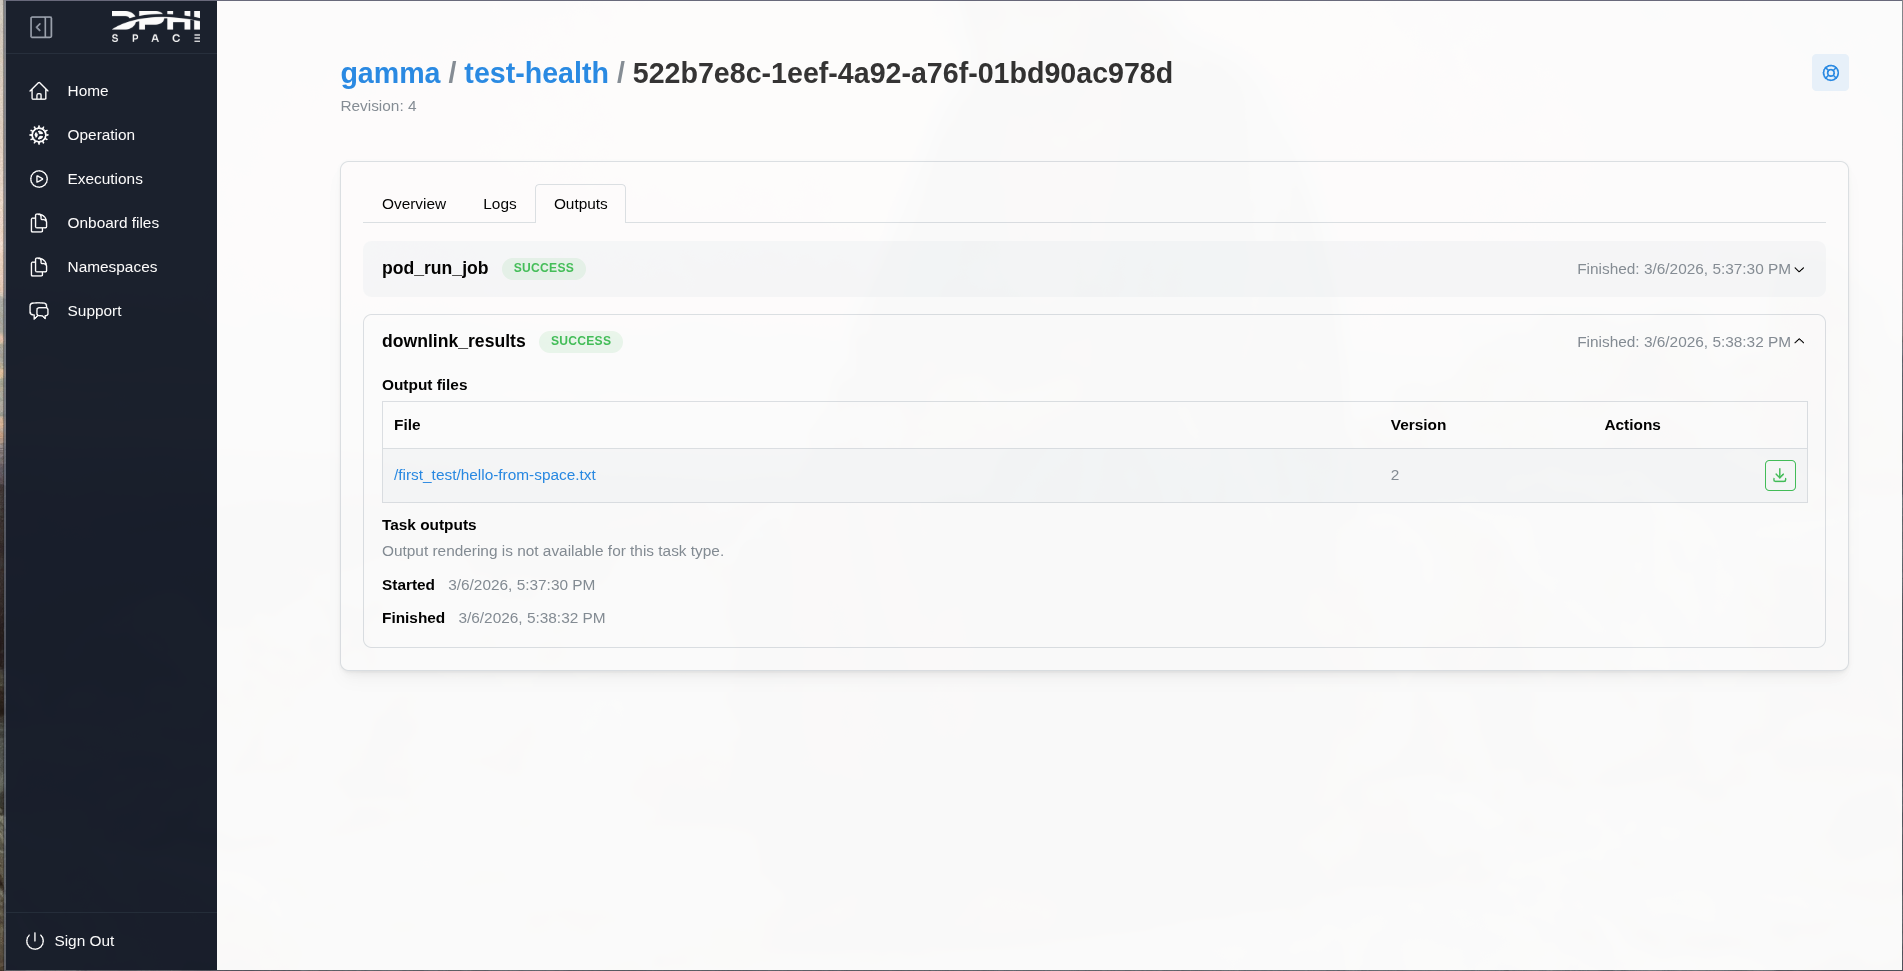
This output can be directly downloaded to the user's PC by clicking the green button to the right of the file. Otherwise, clicking the file name redirects the user to the namespace tab, where the file is highlighted.
Execution states
Executions move through states such as CREATED, SCHEDULED, RUNNING, COMPLETED, and FAILED. Each transition is timestamped to help you track timing and identify where issues occur.
Executions can be deleted while they are still in the CREATED state. Once an execution reaches SCHEDULED, it is already queued for a pass and on track to run, so it can no longer be deleted. The same applies once it is RUNNING.
Deleting an execution is a soft delete. The execution record remains stored but is hidden from normal execution list and detail views unless you explicitly request deleted records through the API.
Deleting an execution does not currently soft-delete its usage metrics. If usage has already been recorded for that execution, tenant quota totals still include it after the execution itself is deleted.
Failure modes
When a task fails for whatever reason, by default all the other tasks will not execute, if the parameter on_failure is set to continue then the tasks following the failed one will still be executed.
Cancelling an Execution
To cancel a Flight Model (FM) execution, click the execution and select the Cancel button. Please note: This does not automatically cancel the execution, but rather sends a cancellation request to our team. As long as the Uplink window has not yet been reached, we will cancel the operation and update its status to CANCELLED.
Tips for troubleshooting
- If an execution fails early, check the first task for validation or input errors.
- For downlink failures, confirm the source path exists onboard and the task volume matches where your pod wrote files.
- For long-running pods, confirm time limits (such as max duration) are sufficient for the workload.